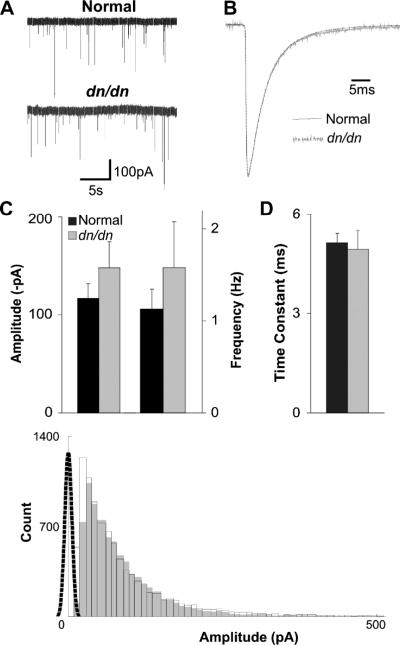
Fig. 2.
Glycinergic mIPSC time constant and amplitude are similar in congenitally deaf and normal mice. A. Examples of glycinergic mIPSCs in LSO principal cells of normal mice (top) and deaf mice (bottom) recorded at room temperature. B. Average minis from a normal (black trace) and dn/dn mouse (grey trace) with normalised amplitudes. C. Amplitudes and frequencies of glycinergic mIPSCs in normal mice (black bars) and deaf mice (grey bars) (no significant difference). D. Decay time constants for glycinergic mIPSCs in normal (black bar) and deaf (grey bar) (no significant difference). E. Histogram (truncated at 500pA for clarity) of glycinergic mIPSC amplitude from normal mice (unfilled black bars) and deaf mice (filled grey bars), with noise distribution (black dotted line).

