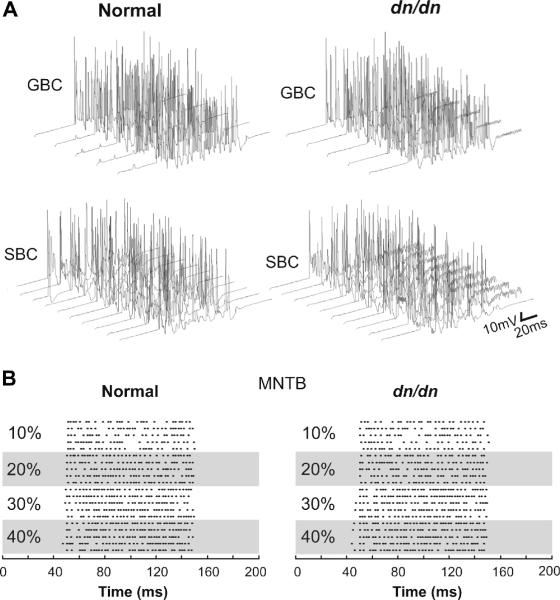
Fig. 7.
Modelled AVCN GBC and SBC and MNTB principal cell responses to a 1 kHz, 100 ms-long electrical stimulation of the auditory nerve. A. Top, 5 Contralateral GBC response to AN stimulation at 10% of the maximum stimulation amplitude. Bottom, 10 ipsilateral SBC response to AN stimulation at 30% of the maximal stimulation amplitude. B. Raster plots showing ipsilateral MNTB principal cell AP times in response to contralateral stimulation of the AN at various amplitudes

