
Fig. 8.
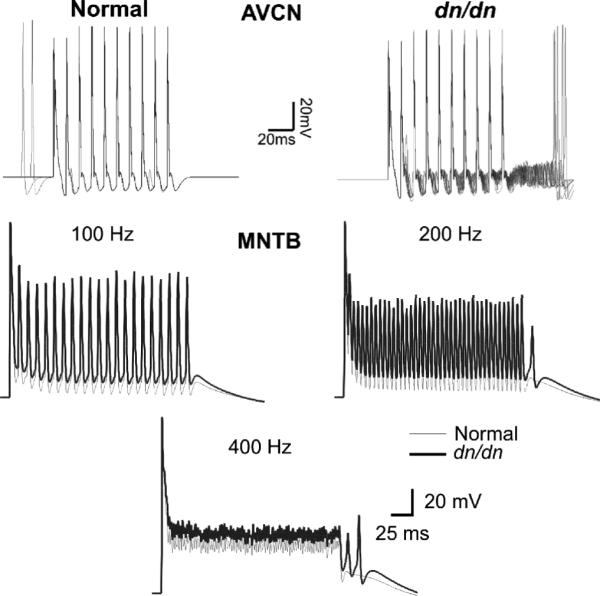
AVCN and MNTB model response to electrical stimulation. Top. Modelled AVCN bushy cells responses (5 normal and 5 dn/dn cells) to a 100 Hz stimulation of endbulbs of Held. Bottom. Modelled normal and dn/dn MNTB principal cell responses to a 100 Hz, 200 Hz and 400 Hz calyceal stimulation.