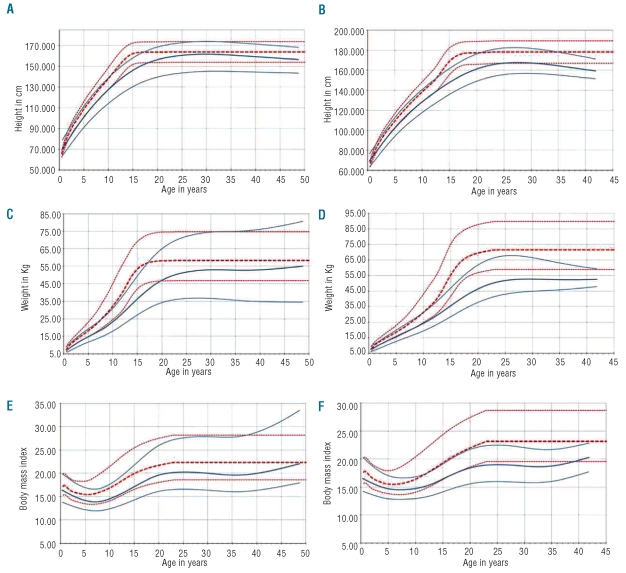
Figure 1.
Height, weight and BMI centile plots for SCA compared to UK reference data.14 (A, C) and (E) are for females and (B, D) and (F) for males. Red dotted lines are the 95th, median and 5th centile curves for UK reference data14 (1990); solid blue lines represent the 95th, median and 5th centile curves for the Tanzanian SCA population. UK reference curves were extrapolated at the same level after the maximum age available of 23 years.

