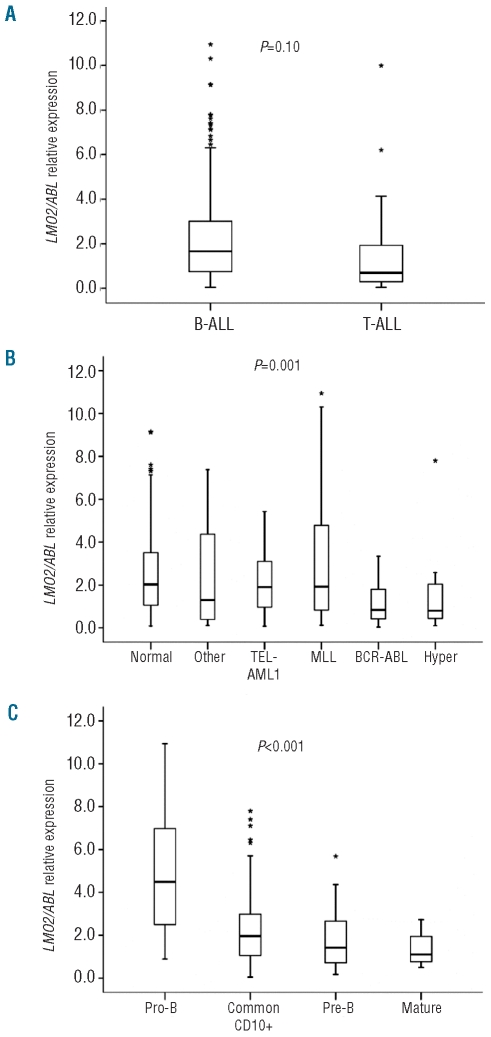
Figure 2.
LMO2 expression changes between B-ALL and T-ALL and among the main immunophenotypical and cytogenetic subtypes of B-ALL. LMO2 expression was measured by Q-RT-PCR. (A) B-ALL vs. TALL comparison was performed by the Mann Whitney U test. LMO2 expression among the different (B) cytogenetic and (C) immunophenotypical subgroups of B-ALL was compared by the Kruskal-Wallis test. The corresponding P values are shown within the graphs. BALL= B-cell acute lymphoblastic leukemia, T-ALL= T-cell acute lymphoblastic leukemia, Hyper= hyperdiploid karyotype (> 50 chromosomes), Normal: normal karyotype, MLL: translocations involving the MLL locus, Other: miscellaneous alterations. (*) depicts outlier values.

