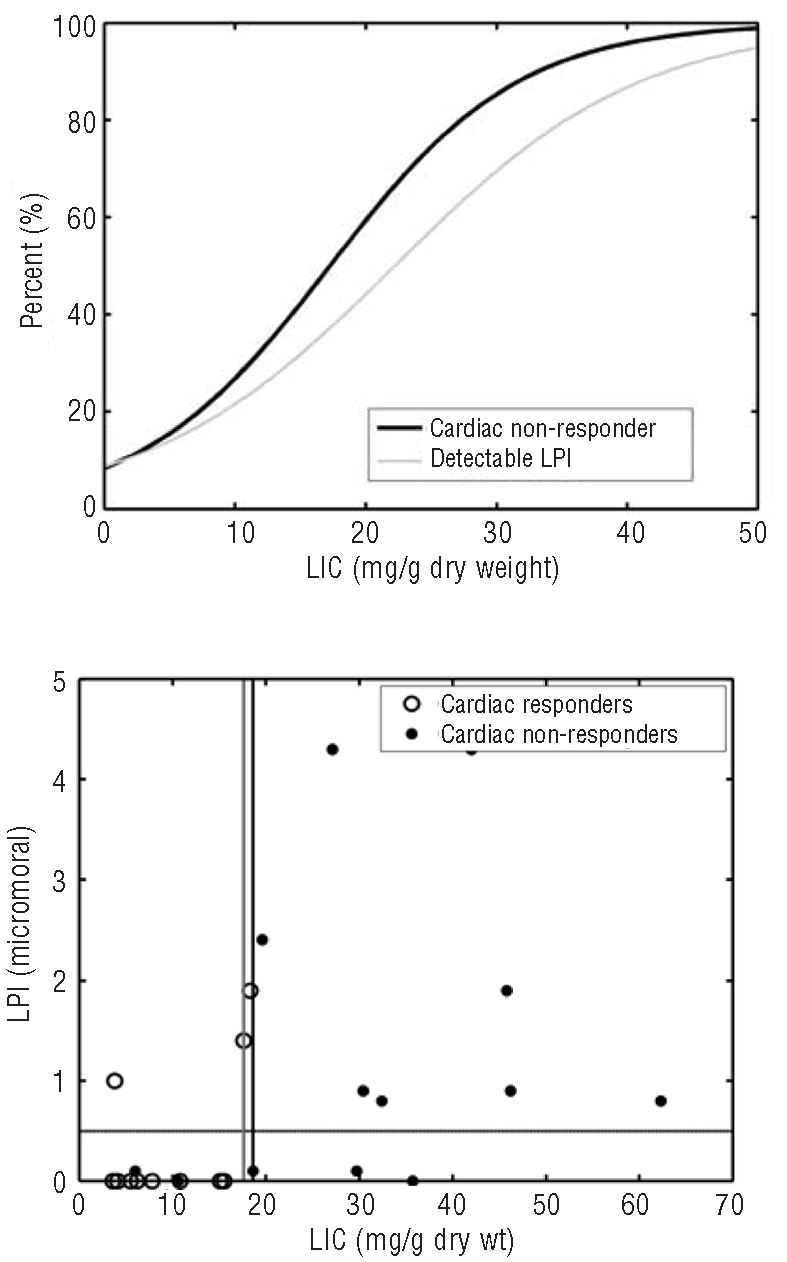
Figure 2.

Percentage of patients with increased LPI (LPI > 0.5 uMol, light line) or who were cardiac non-responders at 18 months (dark line) as a function of baseline liver iron concentration (LIC). Plot of labile plasma iron versus LIC. Solid symbols represent patients who did not respond or did not complete 18 months of deferasirox therapy. Open symbols represent patients whose cardiac T2* improved more than 14.7% from baseline after 18 months of deferasirox at 30–40 mg/kg/day. Horizontal line reflects LPI upper limit of normal (0.5 uMol). Vertical lines represent optimal cut offs generated by ROC analysis for detectable LPI (gray line) and cardiac response (black line).
