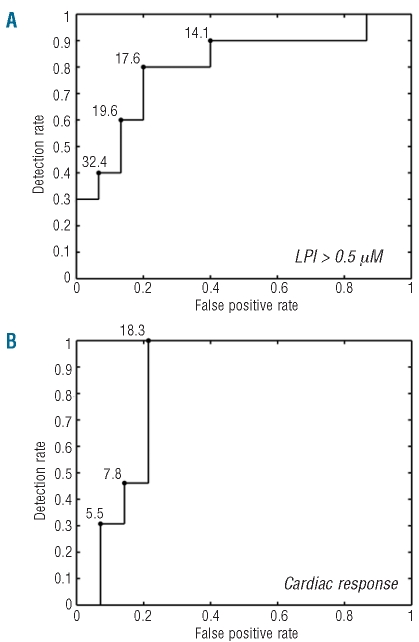
Figure 3.
Receiver Operator Characteristic (ROC) (A) curve for prediction of elevated LPI by liver iron concentration (LIC). Curve represents the trade off between sensitivity and 1-specificity; numbers alongside the curve represent LIC values at critical points. (B) Same representation for the probability of favorable 18 month cardiac response to deferasirox.

