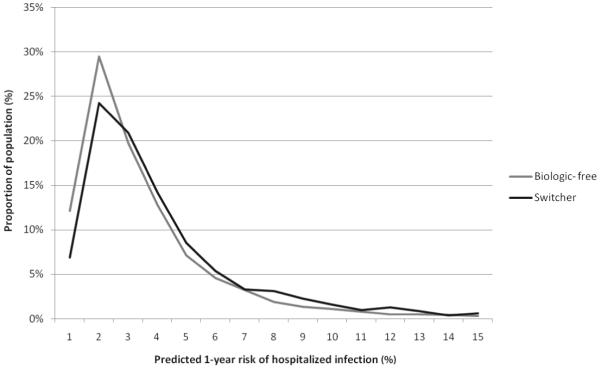
Figure 1.
Distribution of predicted infection risk among biological-free versus switchers. The x-axis is the 1-year predicted risk of hospitalised infection, expressed as a percentage ranging from 0 to 100. The y-axis is the cumulative distribution of infection risk in the biological-free and switcher groups; the area under each of the two curves sums to 100%, representing all patients in that group. The x-axis was right-truncated at 15% to facilitate visual inspection; 97% of the biological-free patients had a predicted 1-year infection risk of 15% or less; 94% of the switcher patients had a predicted 1-year infection risk of 15% or less.

