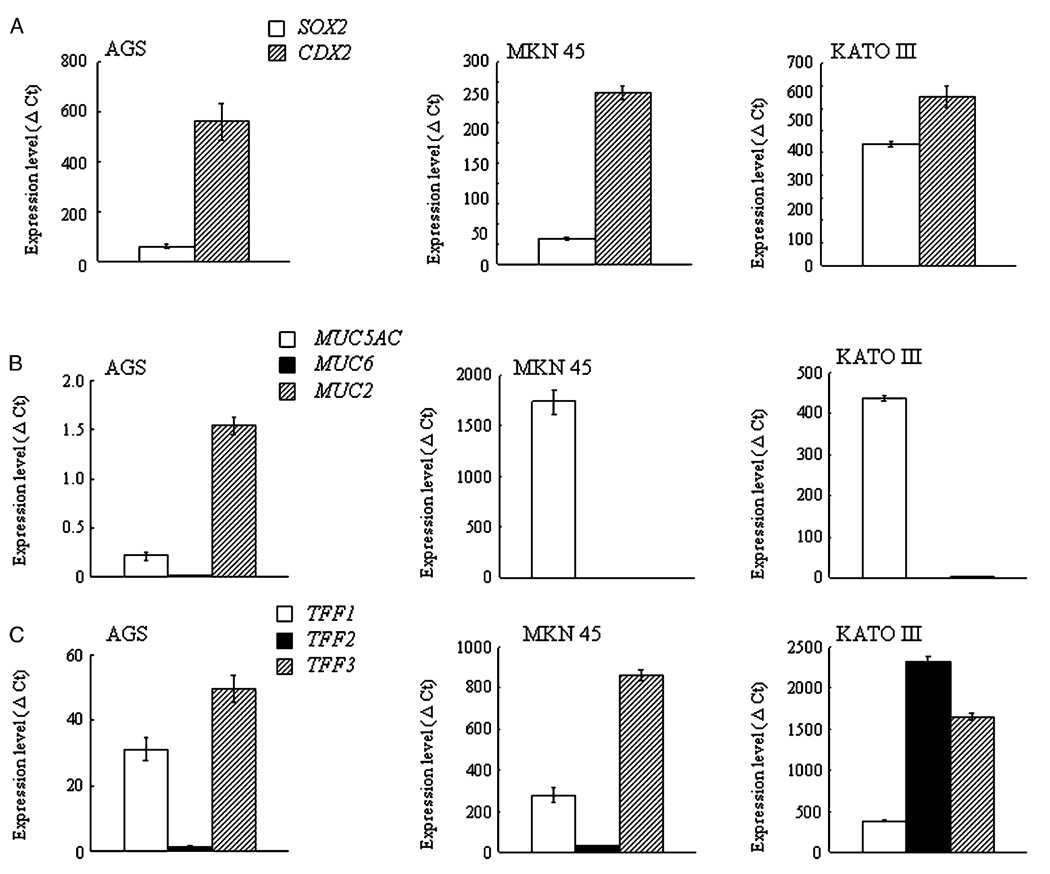
Figure 1.
Unstimulated mRNA levels of transcription factors (SOX2 and CDX2) (A), mucin core proteins (MUC5AC, MUC6, and MUC2) (B), and trefoil factor family peptides (TFF1, TFF2, TFF3) (C) in the AGS, MKN45 and KATO III cells. The change in the comparative threshold cycle (ΔCt) for the target genes was calculated as ΔCt = (Ct of target genes)–(Ct of GAPDH). The ratio of the target genes to GAPDH was calculated as 2−ΔCt and expressed as 2−ΔCt × 105; this ratio was used to evaluate the expression level within each target gene (SOX2, CDX2, MUCs, and TFFs) in the AGS cells, MKN45 cells, and KATO III cells in the unstimulated state. Data are expressed as mean values±SD.

