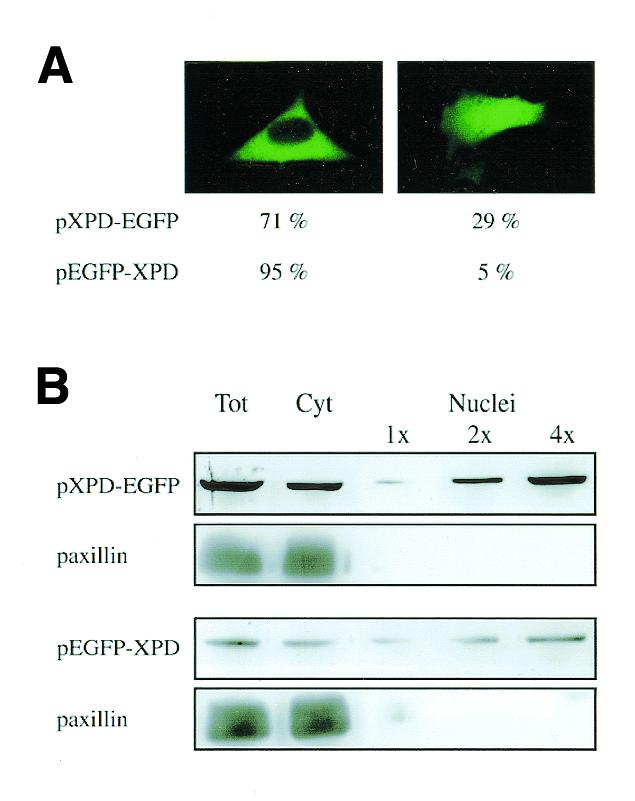
Figure 3.

Subcellular distribution of EGFP-tagged XPD proteins. 3T3 cells were transfected with the XPD expressing plasmids pXPD-EGFP or pEGFP-XPD and analyzed after 24 h. (A) Direct fluorescence of living cells. The number of cells with the staining pattern shown in the photographs is expressed as percentage of 500 transfected cells and represents the mean of five independent experiments. (B) Total cell lysates (40 µg), cytoplasmic (40 µg) and nuclear (1×, 5 µg; 2×, 10 µg; 4×, 20 µg) fractions were analyzed by western blot with anti-GFP antibodies. Adequate cellular fractionation was checked by using antibodies against the cytoplasmic protein paxillin. To visualize the bands, the gel exposure of pEGFP-XPD transfected cells was longer than that of pXPD-EGFP transfected cells and therefore the signal intensity of the immunoreactive material present in the two gels cannot be compared directly.
