
Fig. 3.
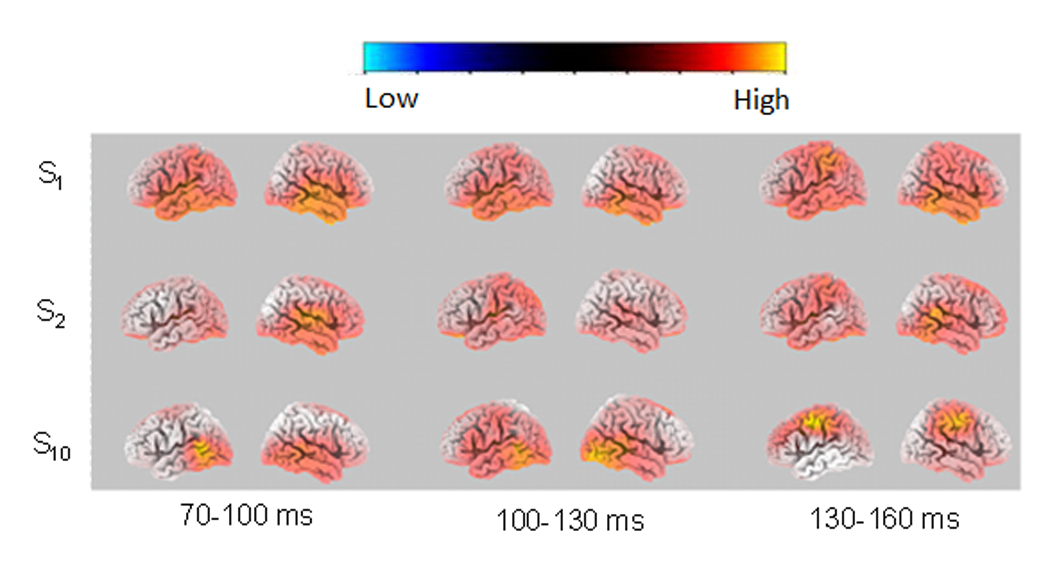
Left and right sLORETA statistical image (voxel-by-voxel t-tests) at the N1 time point corresponding to the maximum sLORETA value for the 70–100 ms, 100–130 ms and 130–160 ms timeframes, for S1, S2 and S10 (vs. baseline). The statistical images were derived by voxel-by-voxel t-tests.