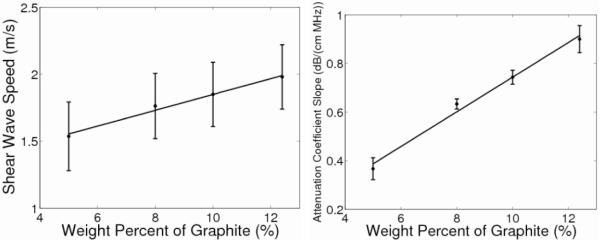
Fig. 1.
Shear-wave speed as a function of graphite concentration (left), with the standard deviations representing the variability over nine different imaging locations. There is a linear correlation between these quantities (R2 = 0.99, p < .01) with a slope of 0.06 (m/s) / [% graphite]. Attenuation coefficient slope as a function of weight percent graphite (right) has a linear correlation as well (R2 = 0.99, p < 0.01) with a slope of 0.07 (dB/(cm MHz)) / [% graphite] with standard deviations over the replicate phantoms.

