
Fig. 3.
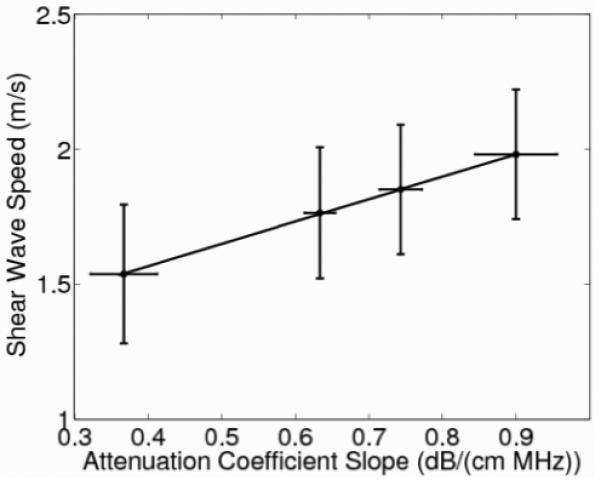
Shear-wave speed as a function of attenuation-coefficient slope modulated by graphite concentration with a slope of 0.83 (m/s)/(dB/(cm MHz)) (R2 = 0.99, p < 0.01.) The shear-wave speed error bars represent variability over the nine different imaging locations in each phantom while the error bars of the attenuation-coefficient slope represent the variability associated with the hydrophone measurements over three replicate phantoms.