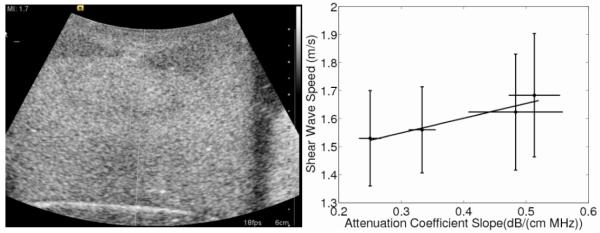
Fig. 5.
Shear-wave speed as a function of attenuation coefficient slope controlled by weight percent of cornstarch is shown with a slope of 0.053 (m/s)/(dB/(cm MHz)) (R2 = 0.97, p = 0.034). The error bars of the shear-wave speed represent variability over the nine different imaging locations in each phantom while the error bars of the attenuation-coefficient slope represent the variability associated with the hydrophone measurements over the replicate three phantoms. The B-mode image (left) shows the heterogeneity that existed in some of the cornstarch phantoms. The top of the phantom has two hypoechoic regions on both sides and an uneven echogenicity in the middle of the phantom that was worse in the more attenuating phantoms.

