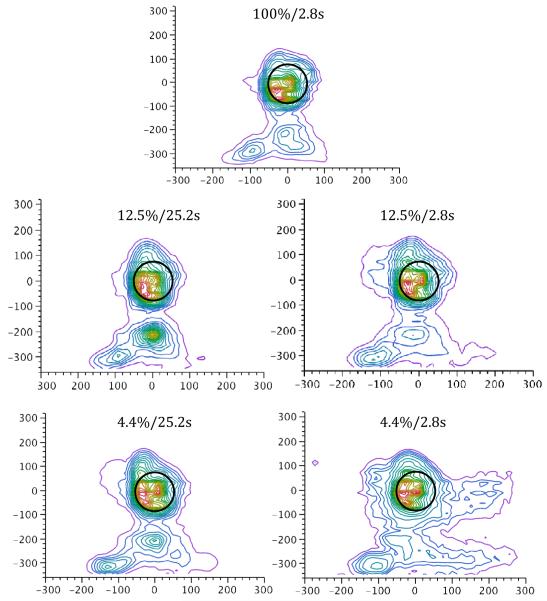
Figure 1.
Nonparametric density plots illustrating the mean spatial location of pecks on the touchscreen for each trial type, collapsed across subject. The peck density plot models a smooth surface that describes how dense the data points are at each point in that surface and functions like a topographical map. The plot adds a set of contour lines showing the density in 5% intervals in which the densest areas are encompassed first. The black circle indicates the location and size of the stimulus disc, which is centered at (0,0). Units on both x- and y-axes are in pixels. The JMP (Version 8, SAS Institute Inc., Cary, NC) bivariate nonparametric density function was used to generate these plots.

