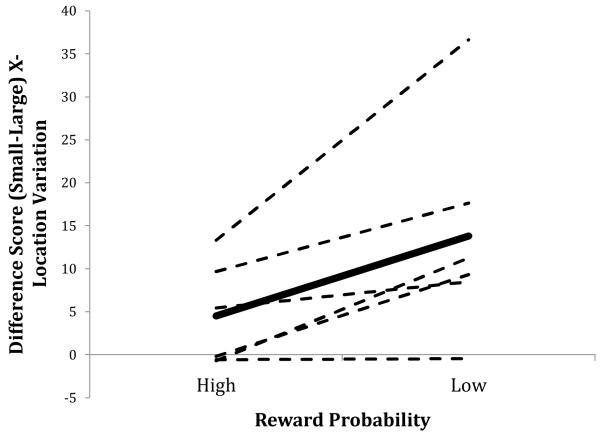
Figure 3.
Mean difference score of the mean standard deviation of x-axis response location as a function of reward probability (High = 12.5%, Low = 4.4%; Large = 25.2 s reward, Small = 2.8 s reward). Values were obtained by subtracting each bird’s mean variation on Large trials from their variation on Small trials for each level of reward probability. The dashed lines indicate individual birds; the solid line indicates the mean across birds.

