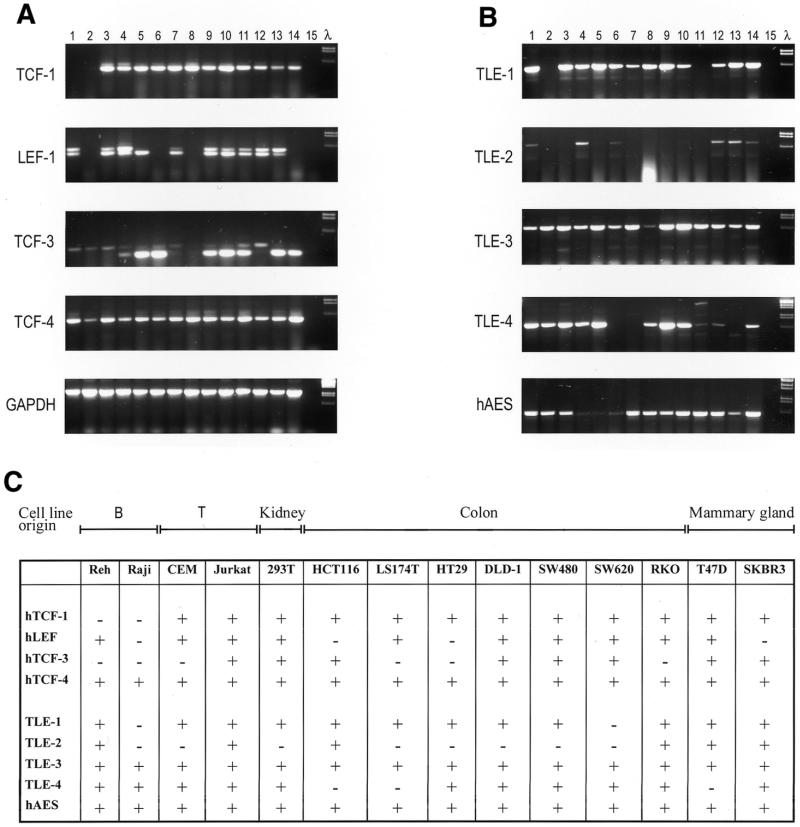
Figure 4.
Expression of (A) hTCF-1, hLEF-1, hTCF-3, hTCF-4; and (B) TLE-1, TLE-2, TLE-3, TLE-4 and hAES was determined by RT–PCR using cDNA generated from a panel of cell lines. Reh (lane 1), Raji (lane 2), CEM (lane 3), Jurkat (lane 4), 293T (lane 5), HCT116 (lane 6), LS174T (lane 7), HT29 (lane 8), DLD-1 (lane 9), SW480 (lane 10), SW620 (lane 11), RKO (lane 12), T47D (lane 13), SKBR3 (lane 14) and H2O control for the PCR (lane 15). The lane marked λ depicts the DNA marker (bacteriophage λ DNA digested with EcoRI and HindIII). Expression is tabulated for Tcfs and TLEs for the given cell lines. +, visible RT–PCR product; –, no visible RT–PCR product.

