
Figure 5. Expression levels of the bcl-2 pro-survival genes in lymphoid and myeloid-derived human malignancies.
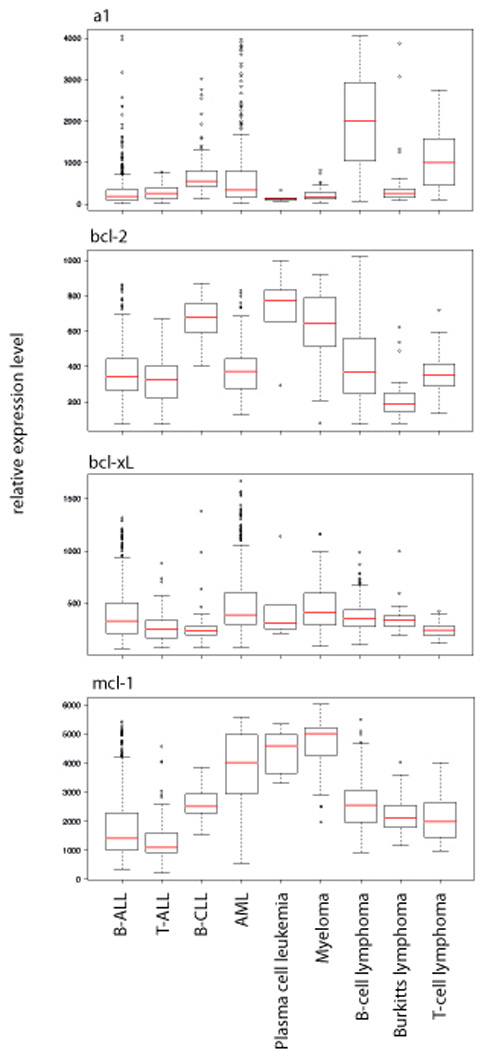
The box and whisker plots summarize the relative expression levels (median value is the red line, lower and upper quartiles represented by the box and the distribution of the data shown by the whiskers) of the bcl-2 pro-survival genes, a1, bcl-2, bcl-xL and mcl-1 in primary B-ALL (n=925), T-ALL (n=68), B-CLL (n=101), AML (n=322), Plasma cell leukemia (n=6), Myeloma (n=102), B-cell lymphoma (n=198), Burkitt lymphoma (n=36) and T-cell lymphoma (n=43) patients. The data have been generated from the GeneSapiens database as described in (Kilpinen et al., 2008), which is a database of the human transriptome based on data generated from Affymetrix arrays.