
Figure 1.
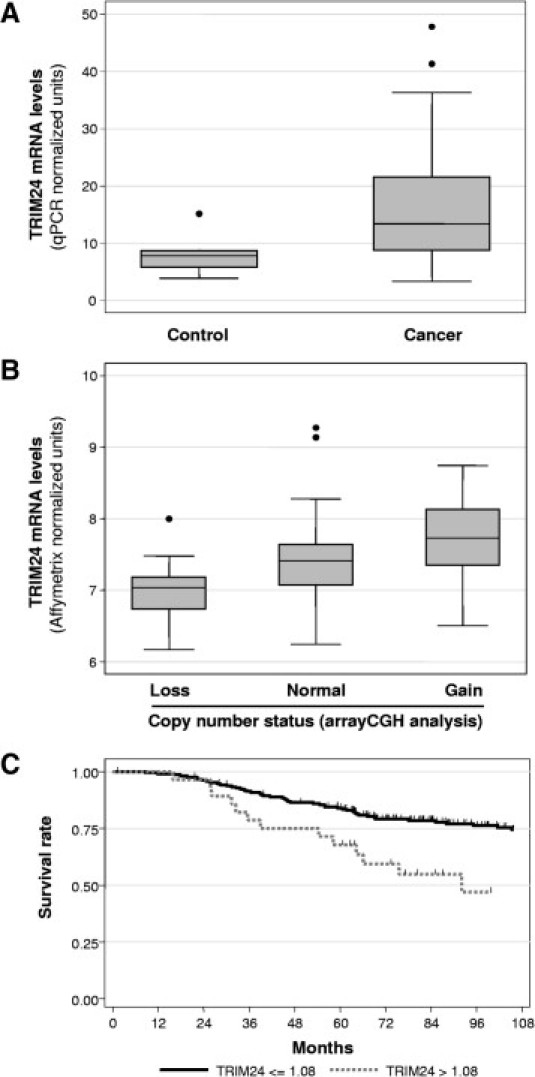
Expression of TRIM24/TIF-1α mRNA in breast carcinomas. A: TRIM24/TIF-1α mRNA levels were determined on 11 normal breast tissues (Control) and 135 breast carcinomas by RT-QPCR as described in Materials and Methods. Data were normalized using the IPO8 and HBMS mRNAs and are presented as box-plots showing the median value, upper and lower quartiles together and minimum and maximum non-atypical data values. B: TRIM24/TIF-1α mRNA levels were determined by Affymetrix microarray analysis (Affymetrix probe set 213301_x_at) in a series of 108 breast tumors with losses (13 cases), gains (18 cases), or no alterations (77 cases) at the corresponding locus as determined by aCGH analysis. Data are represented as box-plots. C: Kaplan–Meier analysis of overall survival according to TRIM24/TIF-1α mRNA expression in the 238-tumor set from Fan et al16. Patients with high TRIM24/TIF-1α mRNA expression (expression level more than the optimal threshold of 1.08 - gray solid line) were compared to patients with low TRIM24/TIF-1α mRNA expression (expression level less than or equal to the optimal threshold of 1.08 - black solid line). Differences in survival rates were statistically significant when compared using a log-rank test (P < 0.001). Tick marks indicate censored events.