
Figure 3.
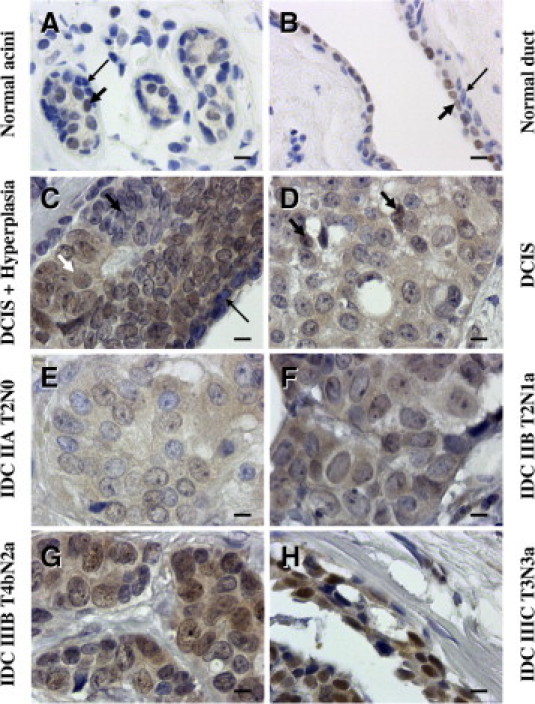
TRIM24/TIF-1α expression in human normal and tumoral tissues. Normal and tumor breast samples of the CBA2 tissue array were immunostained with the rabbit polyclonal TS1 antibody. Normal acini (A) and a normal duct (B) showing weak staining in some nuclei of epithelial cells (arrows). C–H: Representative lesions from six cases of the CBA2 tissue array showing increased intensity of staining with the TS1 antibody. C: Weak staining in a hyperplasic area (shown by a black short arrow) beside unlabeled myoepithelial cells (long black arrow) and labeled intraductal cancerous cells (white short arrow). D: Ductal carcinoma in situ (DCIS) where only two nuclei appear weakly labeled (arrows). E–H: Increase in nuclear staining observed in IDC with different staging (E) stage IIA, N0; (F) stage IIB, N1; (G) stage IIIB, N2; and (H) stage IIIC, N3. Case numbers correspond to an individual patient. (Original magnification X 630; scale bars = 10 μm.)