
Figure 2.
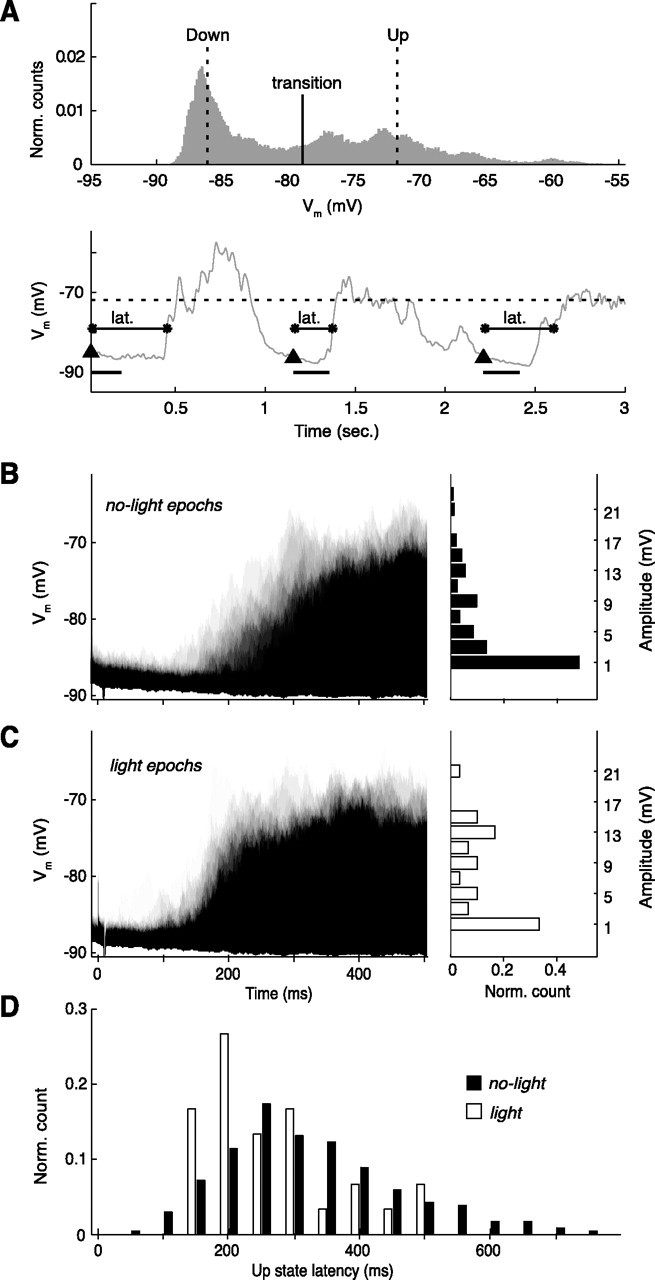
Effects of light flash stimulation on spontaneous activity of a spiny neuron (representative example). A, Top, All-amplitude histogram generated from a 9 s segment of recording. Thresholds for detection of up-state transitions are indicated. Bottom, A sample of the smoothed trace from the same recording. Up threshold (dotted line), down-state onsets (triangles), 200 ms interval for amplitude measurement (black bar), and up-state latency (lat.) are indicated (for definitions, see Materials and Methods). B, C, Left, Time-resolved probability distribution for the neuron to depolarize from the down-state membrane potential (y-axis) during no-light epochs (B) (n = 34 random sample from 236) and light epochs (C) (n = 30); black depicts a high probability, the lightest gray shade represents one trial; timescale is the same as in C. Right, Amplitude distributions of depolarizations from the down state. Note that, after a light flash, stronger depolarizations were measured in this neuron (6.5 vs 2.3 mV; Wilcoxon's rank sum test, p < 0.01). D, The distribution of up-state latencies reveals shortened latencies after light flash stimulation (255 ms; compared with 312 ms for no light; Wilcoxon's rank sum test, p < 0.05).