
Figure 5.
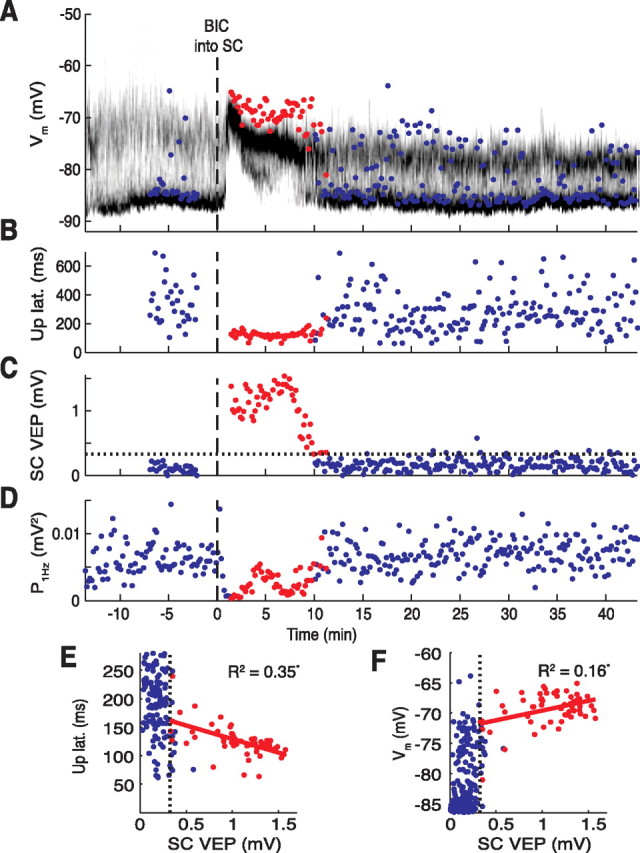
Effects of BIC on visual responsiveness of the SC and a spiny neuron in single trials. Time on the x-axis is given in relation to BIC ejection (dashed line at 0). A, Time-resolved membrane potential distribution. Grayscale indicates the probability for the neuron to be at a respective membrane potential (y-axis); black depicts a high probability, and white depicts a low probability. Colored circles indicate point of early depolarization amplitude achieved during the first 200 ms after the light flash; a red circle indicates that the SC was visually responsive at the time (see C). B, Up-state latencies of light responses. Note the consistently short latencies when the SC was responsive (red circles). C, Amplitudes of the collicular VEP. Amplitudes after BIC exceeding the 99th percentile of no-light responses (indicated by the horizontal dotted line) were considered as significant visual responses (red circles). D, The EEG power at 1 Hz. Note the decrease after BIC ejection. E, F, Scatter plots of up-state latencies (E; from B) and early depolarization amplitudes (F; from A) versus the amplitude of the VEP (from C). The vertical dotted lines represent the 99th percentile of SC no-light responses. Only data points of significant collicular VEPs after BIC were included in the regression fits (red circles). Correlation coefficients (R2) were statistically significant (p < 0.05).