
Figure 6.
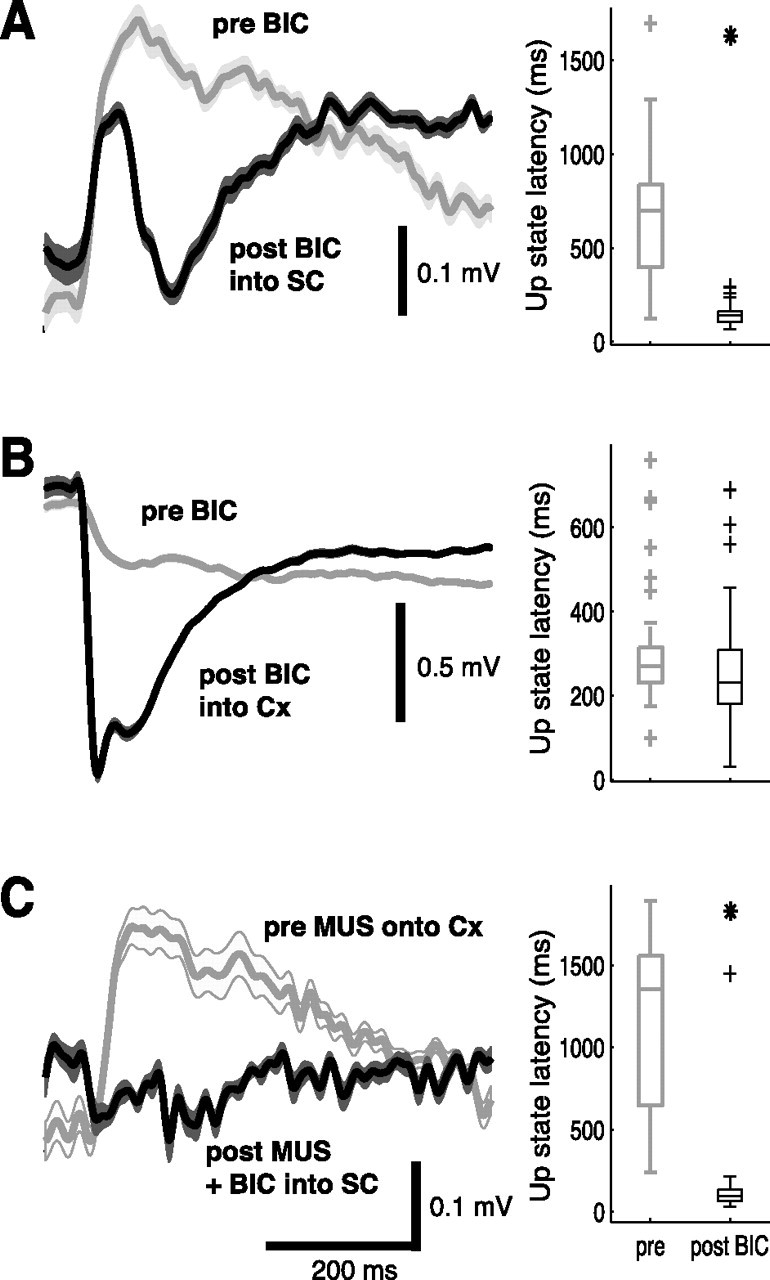
Changes in visual sensitivity of primary visual cortex and striatal spiny neurons are not correlated. The left panels show a typical example of a mean cortical VEP before (gray) and after (black) BIC ejection; lighter shades indicate SEM. The right panels show distribution of up-state latencies measured simultaneously (except in C) in a striatal spiny neuron in box plots; median (central line), quartiles (bar limits), range (error bars), and outliers (+) are indicated. The asterisks indicate that latencies are significantly shorter than in light epochs before BIC (p < 0.05, Wilcoxon's rank sum test). A, BIC ejection into the SC induces visual responses in spiny neurons but also affects the cortical VEP. B, BIC ejected into the visual cortex increases the VEP recorded through the adjacent LFP electrode but fails to induce visual responsiveness in the striatal spiny neuron. C, The cortical VEP (gray) recorded before the penetration of the neuron is suppressed after MUS ejection onto the cortex (black). Nevertheless, BIC ejection into the SC still induces visual responses in the spiny neuron.