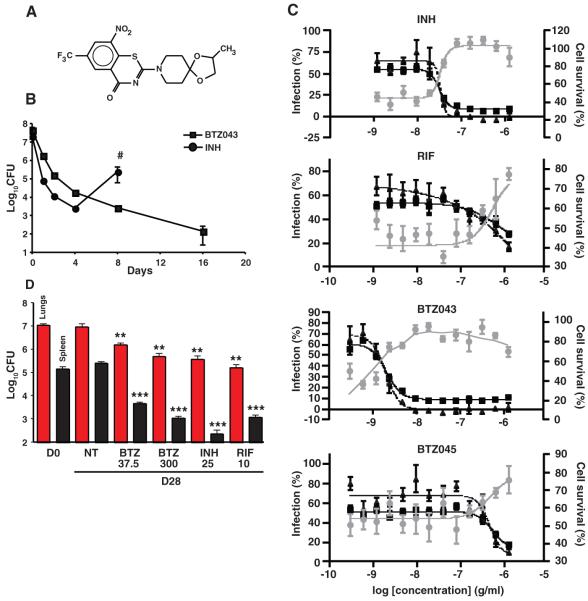
Fig. 1.
Comparative BTZ efficacy in in vitro, ex vivo, and mouse models. (A) Structure of BTZ038. The chiral center involves the methyl group at right. (B) Kill-kinetics in batch culture showing a decrease in viability of M. tuberculosis H37Rv in 7H9 medium containing BTZ043 in comparison with INH (both at 200 ng/ml). The regrowth after treatment with INH (pound sign indicates the experiment was terminated because of resistance) is not seen with BTZ043. (C) Response of macrophages infected with GFP-labeled M. tuberculosis to treatment with different compounds, expressed in percent of bacterial load (triangles), cell survival (circles), and infected cells (squares) relative to compound concentration in grams per milliliter. Each percentage is based on DMSO and INH controls from the same experiments. For each concentration, the mean ± SEM of the quadruplicate are reported. For the original images, see fig. S2. (D) Efficacy of BTZ043 in a mouse model of chronic tuberculosis compared with INH, rifampin (RIF), and untreated controls. Red and black columns correspond to the bacterial load in the lungs and spleens, respectively, of chronically infected BALB/c mice (4 weeks after infection) at day 0 (D0), before treatment. The remaining columns show bacterial loads at day 28 in untreated animals (NT) (5 per group) or in mice treated with various drugs at the doses indicated (milligrams per kilogram of body weight per day). Bars represent the mean ± SEM; data are representative of two independent experiments from two different centers. **P = 0.001; ***P < 0.000001.

