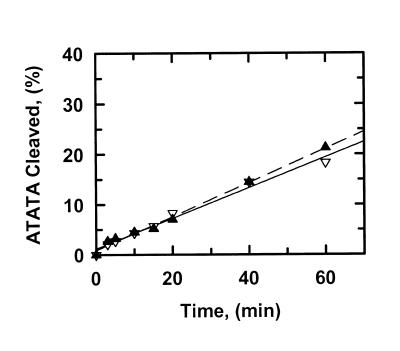
Figure 2.
Cleavage of ATATA. The reactions in SfiI assay buffer at 30°C contained either 0.2 µM ATATA and 0.5 nM SfiI endonuclease (data points marked by inverted triangles) or 1.0 µM ATATA and 2.5 nM SfiI (marked by triangles). The DNA was 5′-end-labelled with 32P in the top strand. At timed intervals after adding SfiI, samples were withdrawn from the reactions and analysed as in the Materials and Methods to determine the percentage of the substrate that had been cleaved in the top strand. Each data point is the mean from four or more separate experiments. The solid and dashed lines are the optimal fits to linear slopes for the data at 0.2 µM ATATA and at 1.0 µM ATATA, respectively. The optimal fits yielded the reaction velocities given in Table 1.

