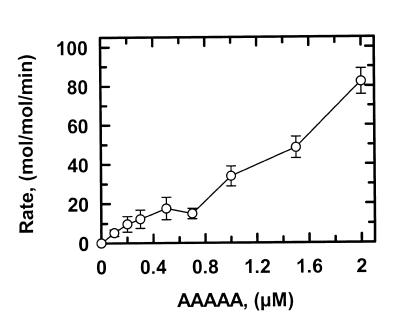
Figure 3.
Cleavage of AAAAA. The reactions in SfiI assay buffer at 30°C contained the concentration of AAAAA (5′-end-labelled with 32P in the top strand) noted on the x-axis and SfiI endonuclease at a 400-fold lower concentration than the substrate. At timed intervals after adding SfiI, samples were withdrawn from the reactions and analysed as in the Materials and Methods. The increase in the concentration of cleaved DNA with time, during the initial phase of each reaction, was fitted to a linear slope so as to obtain the reaction velocity. The velocities (mol DNA cleaved per min) were then normalised against the enzyme concentrations to give the rates shown on the y-axis. The error bars are the standard deviations from the means from two or more separate experiments.

