
Fig. 1.
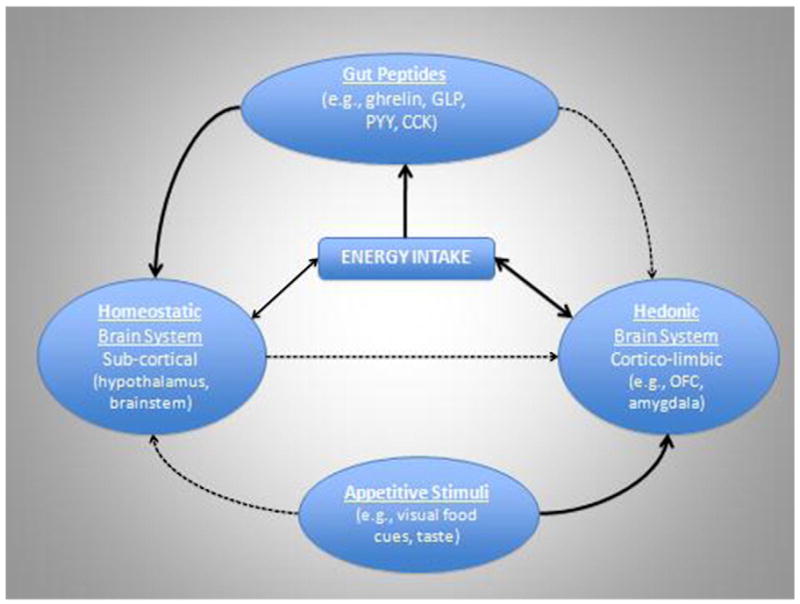
Cartoon representation of the relevant influences on energy intake. The strength of evidence in support of each association is represented by the thickness of the connecting arrows with bolded lines representing strong empirical support and the dotted lines representing more theoretical evidence.