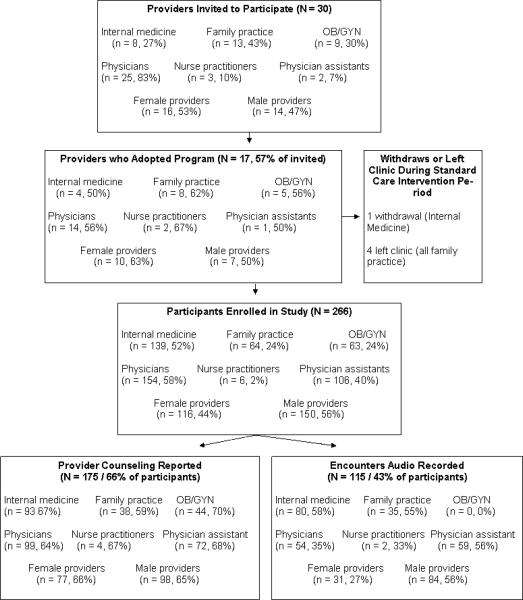
Figure 1.
Provider adoption and implementation of study protocol. The bottom 2 boxes report the number and percentage of encounters where provider counseling was reported (left side) and counseling was audio recorded (right side) relative to the total number of participants seen at that clinic type, by provider degree, and by provider gender.

