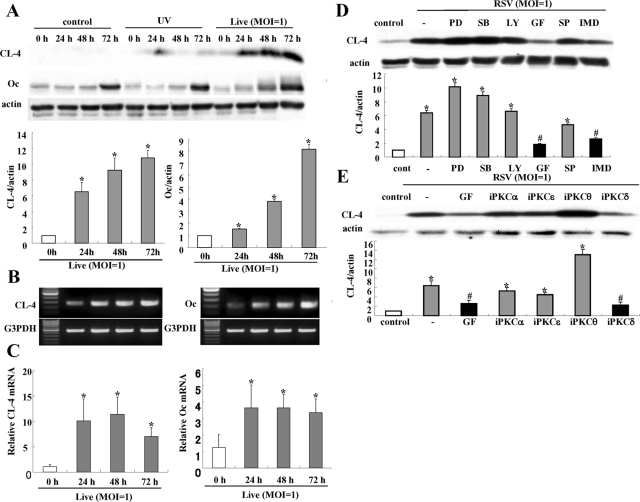
FIGURE 2:
Induction of claudin-4 and occludin in HNECs infected with RSV. (A) Western blot for claudin-4 and occludin in HNECs infected with RSV at an MOI of 1 or with UV-treated RSV. The corresponding expression levels of (A) are shown as bar graphs. Data are means ± SEM, *p < 0.01 compared with 0 h. RT–PCR (B) and real-time PCR (C) for claudin-4 and occludin in HNECs infected with RSV at an MOI of 1. Data are means ± SEM, *p < 0.01 compared with 0 h. (D) Western blot for claudin-4 in HNECs pretreated with inhibitors of signaling pathways 30 min before infection with RSV at an MOI of 1 for 24 h. The corresponding expression levels of (D) are shown as bar graphs. Data are means ± SEM, *p < 0.01 compared with control, #p < 0.01 compared with RSV. PD: MAPK inhibitor PD98059; SB: p38 MAPK inhibitor SB203580; LY: PI3K inhibitor LY294002; GF: pan-PKC inhibitor GF109203X; SP: JNK inhibitor SP600125; IMD: NF-κB inhibitor IMD-0354. (E) Western blot for claudin-4 in HNECs pretreated with inhibitors of PKC isoforms 30 min before infection with RSV at an MOI of 1 for 24 h. GF: pan-PKC inhibitor GF109203X; iPKCα: PKCα inhibitor Gö6976; iPKCδ: PKCδ inhibitor rottlerin; i PKCθ: PKCθ inhibitor myristoylated PKCθ pseudosubstrate peptide inhibitor; iPKCε: PKCε inhibitor PKCε translocation inhibitor. The corresponding expression levels of (E) are shown as bar graphs. Data are means ± SEM, *p < 0.01 compared with control, #p < 0.01 compared with RSV.

