FIGURE 1:
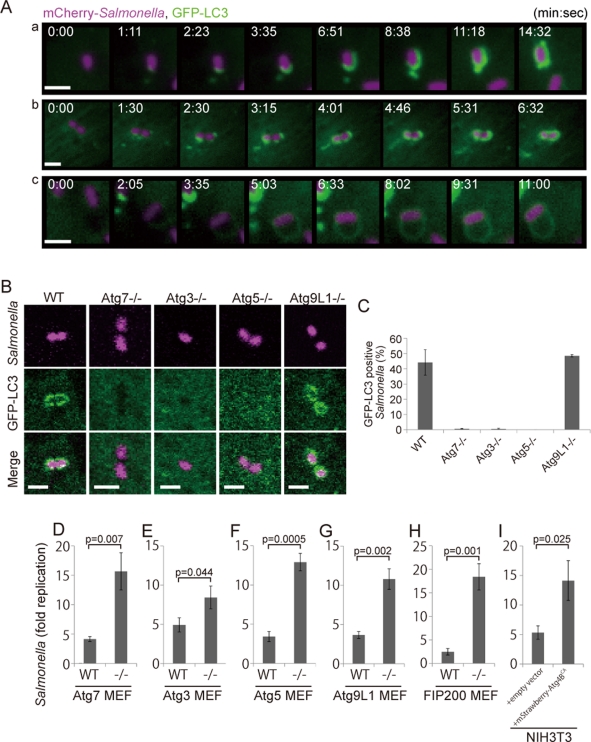
GFP-LC3 association with infected S. typhimurium. (A) MEFs stably expressing GFP-LC3 were infected with S. typhimurium expressing mCherry for 5 min and then washed to remove the inoculum. The cells were imaged at ∼15-s intervals using a fluorescence inverted microscope. Live-cell imaging is shown and the elapsed time after the association of GFP-LC3 is indicated. Scale bar: 1 μm. (B and C) MEFs with deletions in each of the noted Atg genes and their parental cells stably expressing GFP-LC3 were infected with S. typhimurium expressing mCherry for 1 h at an MOI of 10 and then washed. The samples were fixed, and the GFP-LC3 association rate was examined by fluorescence microscopy. The average ± SD is shown for three independent experiments where at least 100 bacteria were counted. Scale bar: 2 μm. (D−I) MEFs of the noted Atg KOs and their parental cells or NIH3T3 cells with or without Atg4BC74A expression were infected with S. typhimurium for 10 min in DMEM without antibiotics at an MOI of 100. After infection, the cells were washed to remove extracellular S. typhimurium and incubated in DMEM containing gentamicin for 6 h. The cell lysates were plated on LB plates and the number of colonies was counted after a 1-d incubation at 37°C. The average ± SD of three independent experiments is shown.

