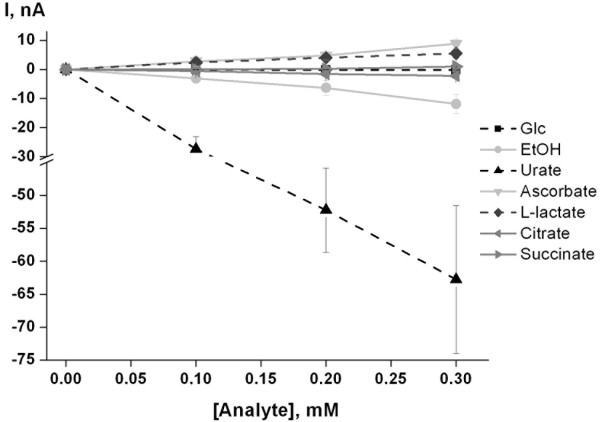
Figure 8.
Selectivity of the optimized biosensor. Currents and relative responses of different concentrations of D-glucose, ethanol, urate, ascorbate, L-lactate, citrate and succinate are shown (-50 mV vs. Ag/AgCl). HRP and cell suspension were entrapped behind the dialysis membrane (cut off 10 kDa). Testing solution: 30 mM Tris-HCl (pH 8.9); working volume: 20 mL; stock solution of D-glucose, ethanol, urate, ascorbate, L-lactate, citrate and succinate: 10 mM in 30 mM Tris-HCl (pH 8.9). Sensor calibrations by possible urate interfering compounds were performed on the same electrodes. Urate calibration was performed after all measurements.

