
Figure 4.
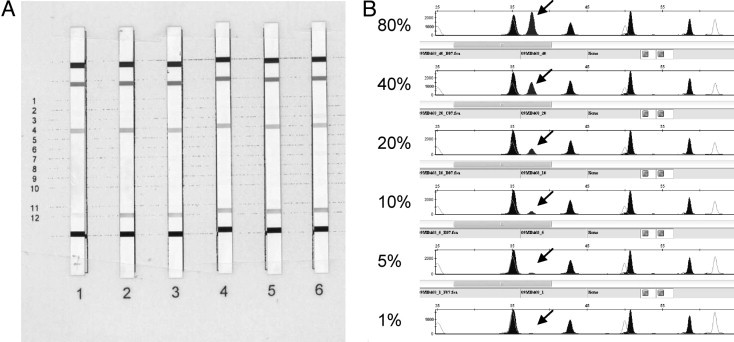
Sensitivity comparison between StripAssay (A) and SNaPshot (B) using a tumor DNA dilution series with a known mutation codon 12 Val. (1 = 80%, 2 = 40%, 3 = 20%, 4 = 10%, 5 = 5%, and 6 = 1% tumor cells). Sensitivity comparison between StripAssay and SNaPshot using a tumor DNA dilution series with a known mutation codon 12 Val. (1 = 80%, 2 = 40%, 3 = 20%, 4 = 10%, 5 = 5% and 6 = 1% tumor cells). Arrows show the mutation.