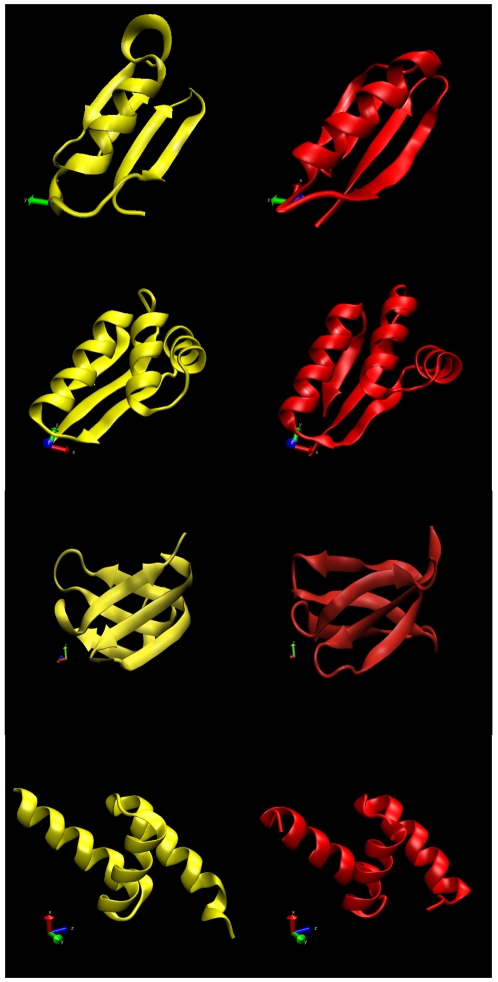
Figure 2. Comparison of the designed (yellow) and the target (red) structures for the four proteins analyzed in this work, from top to bottom.
(a) Protein G (PDB ID 1PGB)  DRMSD (
 RMSD 0); (b) L7/L12 (PDB ID 1CTF)
 DRMSD (
 RMSD 0); (c) lipoprotein (PDB id 2K57)
 DRMSD (
 RMSD 0); (d) UBA domain of Tap/NXF1 (PDB ID 1OAI)
 DRMSD (
 RMSD 0).

