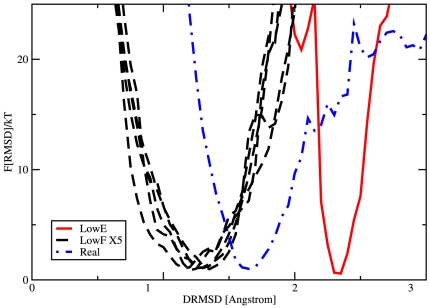
Figure 4. Comparison of the folding free energies  of 6 designed sequences and of the real sequence for L7/L12 as a function of the root mean square distance (
 ) from the target structure.
The profile of  (black dashed line) for 5 sequences selected from the ensemble of those with the lowest free energy in sequence space (LowF in Fig. 3) is compared with the profile (red line) obtained for a sequence with lower energy (LowE) than the previous ones. The free energy has been calculated at the same temperature
  . The folding efficiency of the LowF sequences is very different from the one of LowE as the latest one cannot reach a proper folded structure. Finally we also plot the folding free energy for the real sequence (Real) of the same protein L7/L12 (point dash blue line). At
  , we found the minimum of
  to be around 1.6
  (
( RMSD), indicating that the designed proteins are folded correctly on their targets.

