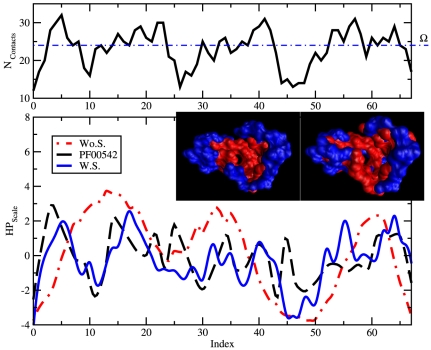
Figure 5. Hydrophobic/philic profile of the protein L7/L12 (PDB ID 1CTF) designed with and without the solvation term.
In the top frame we plot the number of contacts that each amino acids along the chain has with the all the other non consecutive amino acids in the range of  defined by our potential in Eq. (2). Large numbers indicate amino acids that are buried in the core of the protein while low number correspond to residues that are highly solvated. The dashed horizontal line refers to the value
  in Eq. (2). In the bottom frame we compare the hydrophobic/philic profiles averaged over the designed sequences, with (W.S., blue continuous line) and without (Wo.S., red point-dash line) the solvation term in Eq. (3), to the average profile obtained from the Pfam alignment data (PF00542, black dashed line) corresponding to the structure L7/L12. W.S. sequences capture many of the features of the HP profiles of the PF00542 and follows more closely the profile described in the top frame, indicating that we design proteins with an hydrophobic core surrounded by hydrophilic amino acids, which overall is more realistic. It has to be noted that the discrepancies between the designed and the real proteins (between residue 20 and 30 and around residue 45) occur in regions where structurally one would expect hydrophilic amino acids. The unexpected hydrophobic patches present in the wild type proteins may very well be involved in the function of the protein in vivo that we do not take into account during the design procedure. In the inset From left to right, comparison of the designed (W.S.) and the native hydrophilic (blue) and hydrophobic (red) amino acids distributions for L7/L12.

