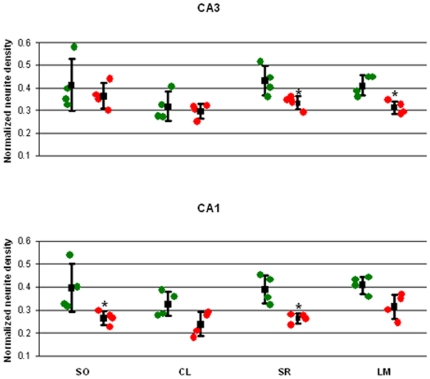
Figure 2. CA3 and CA1 normalized neurite density of stratum oriens (SO), cell layer (CL), stratum radiatum (SR) and stratum lacunosum moleculare layer (LM).
Individual data from controls rats (green dots) and stressed rats (red) are shown in conjunction with the mean values and standard deviation (black). *P<0.05.

