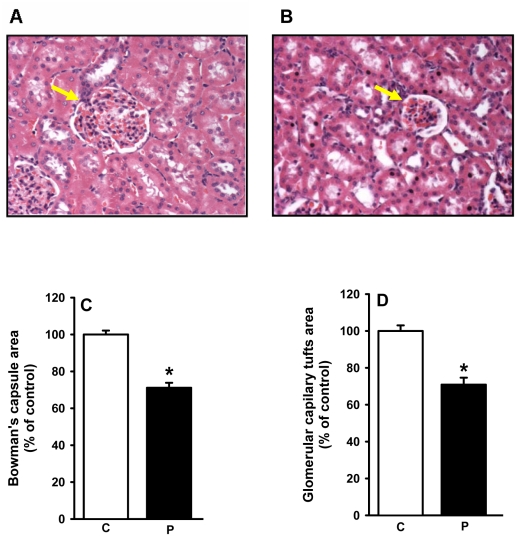
Figure 4. Glomerular morphometry in control and programmed offspring.
The areas of the Bowman's capsule and of the capillary tuft in the cross section of glomeruli were assessed as described in the Materials and Methods. For number of rats, number of screened tissue sections and number of glomeruli counted, see Materials and Methods. Panels A and B show representative photomicrographs (200×) of HE-stained sagital kidney sections of control and programmed rats, respectively. Arrows indicate glomerular structures. Panel C: quantification of the Bowman's capsule area expressed as a percentage of the control group. Results were statistically analyzed and then converted to percentage values (n = 3; *P<0.001). Panel D: quantification of the capillary tuft area expressed as a percentage of the control group (n = 3; *P<0.001). On the abscissae of panels (C) and (D), the capital letters C and P indicate the control and programmed groups, respectively.

