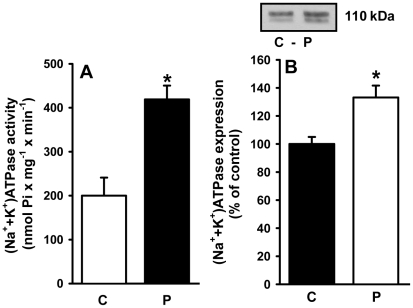
Figure 6. Activity and expression of (Na++K+)ATPase in basolateral membranes of kidney proximal tubule cells.
(A) (Na++K+)ATPase activity was measured in membranes isolated from control (C) and programmed (P) offspring, as indicated on the abscissa. Data are means ± S.E.M. of six (control) and eight (programmed) determinations carried out in triplicate using different membrane (rat) preparations. *Statistically different from C (P<0.01). (B) Expression of (Na++K+)ATPase. Upper panel: representative immunoblotting of α1 subunit. Lower panel: densitometric quantification (means ± S.E.M.) of five simultaneous determinations carried out with four different membrane preparations from each group (C and P). The band intensity of the control group was taken as 100%. *Statistically different from the control group (P<0.05).

