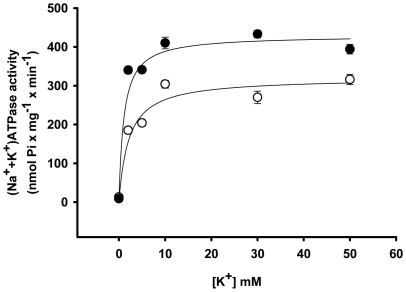
Figure 7. Apparent affinity for K+ of renal (Na++K+)ATPase.
The (Na++K+)ATPase activity was assayed at the K+ concentrations presented on the abscissa (starting with a contaminant concentration of 0.1 mM K+ according to flame photometric determinations performed after preparation of the solution was completed). The Na+ concentrations ranged from 150 to 100 mM to keep the sum of Na+ plus K+ concentrations equal to 150 mM in all tubes. The hyperbolic function v = Vmax×[K+]/(K0.5+[K+]) was adjusted to the experimental points obtained with the use of membranes isolated from control (open circles) and programmed (filled circles) offspring. Data are means ± S.E.M. of at least seven determinations carried out in triplicate with four different preparations from each group (C and P). The abbreviations of the expression correspond to activity at each K+ concentration (v), extrapolated maximal velocity (Vmax) and to the K+ concentration at which v = Vmax/2 (K0.5).

