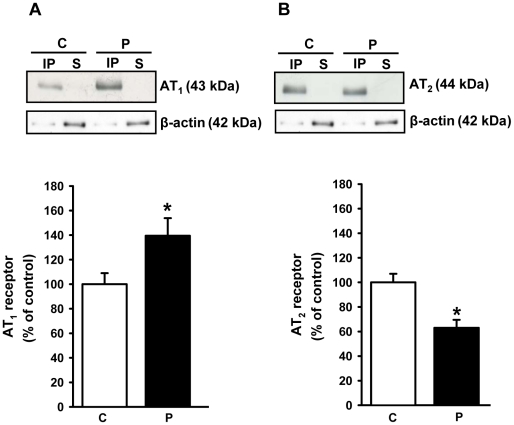
Figure 10. Expression of Ang II receptors.
Ang II receptors (AT1 and AT2) were immunodetected in proximal tubule cell membranes of control (C) and programmed (P) offspring. (A) AT1 receptors. (B) AT2 receptors. In (A) and (B): upper panels show representative immunoblots after immunoprecipitation with the corresponding antibodies (IP, immunoprecitate; S, supernatant); middle panels show immunodetection of β-actin probed in the same membrane, which was used to asses protein loading in the gels; lower panels show densitometric quantification (means ± S.E.M.) of five immunodetections carried out with different membrane preparations. The band intensity of the respective control group was taken as 100%. *Statistically different from the control group (P<0.05).

