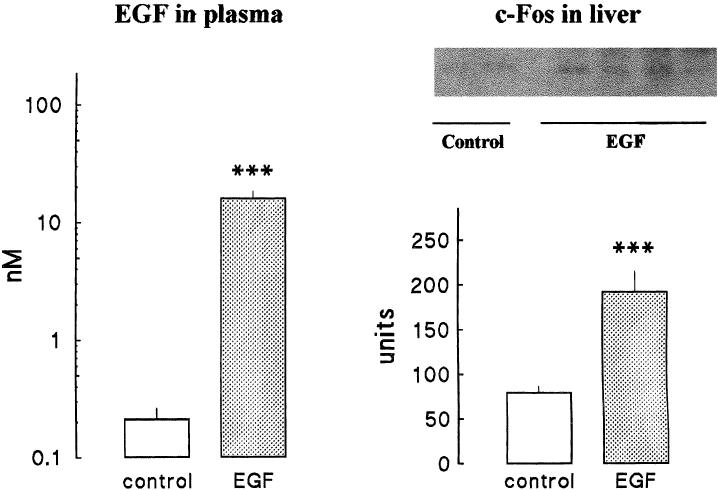
Fig 2.

EGF administration induces c-Fos accumulation in mice liver. Mice (anesthetized with sodium pentobarbital, 60 mg kg−1) were injected with EGF (0.25 mg kg−1 intraperitoneally) (dotted bars). Control animals (white bars) received an identical volume of saline (6 mL kg−1). After 30 minutes, animals were killed and samples were obtained to determine EGF in plasma and c-Fos in liver. Left panel shows EGF in plasma and bars represent the mean ± SE of 5 animals per group. Right panel shows c-Fos protein. The upper side shows the results of 2 control and 4 EGF-injected mice (25 μg of protein per lane). The lower side of this panel shows the results of the quantification (arbitrary units) of 5 animals per group. Statistical comparisons were made by Student's t-test. *** P < 0.001
