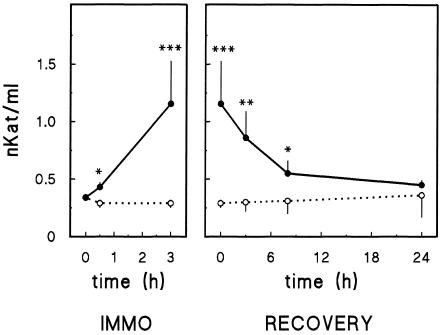
Fig 3.
Effect of immobilization on plasma ALT activity. Left: mice were immobilized (•) for the indicated period. Control animals (○) were maintained in their cages. At indicated time, animals were processed to determine plasma ALT activity. Right: animals were immobilized for 3 hours (•) and then returned to their cages. Control animals (○) were maintained in their cages all the time. At the indicated time of recovery, animals were processed to determine plasma ALT activity. Results are the mean ± SE of 15 animals per group. Statistical comparisons vs corresponding control value were made by Student's t-test. * P < 0.05; ** P < 0.01; *** P < 0.001

