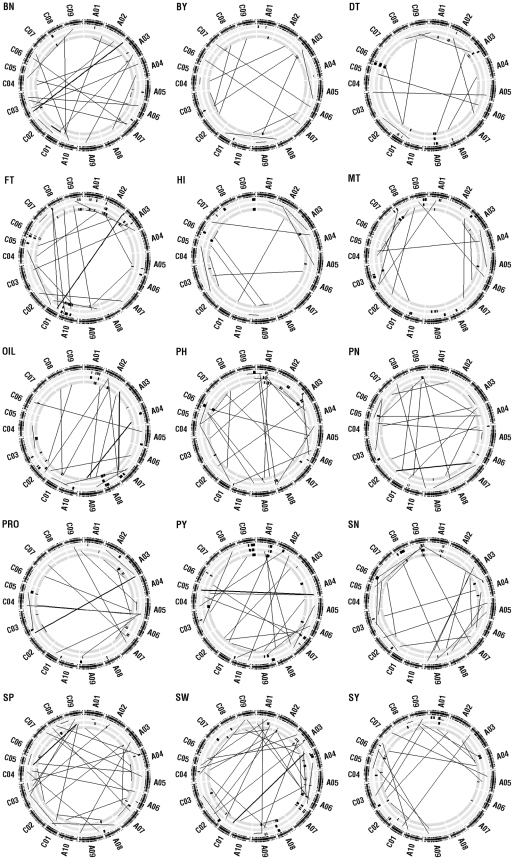
Figure 2. The genome-wide distribution of epistatic interactions identified in reconstructed F2 and three environments for each of the 15 yield-correlated traits.
The TNDH linkage map was shown as a black circle (separated by a small gap) with vertical lines to indicate the position of the molecular markers, and around which the labels represent the names of the 19 linkage groups (A genome: A01-A10; C genome: C01-C09). The following three grey circles represent the three environments (from outside to inside, that is S6, S5 and N6 evinronment), on which The long black lines indicated the positions of the two loci involved in epistatic interactions and the width of the epistatic interaction line imply the magnitude of their phenotypic variance (R 2<10%; 10%≤R 2<20%). To illustrate the relationship of the positions of QTL and epistatic interactions, the QTL are also drawn with short curves where their lengths show the confidence interval and the circle indicates the peak position. The letters at the top left corner of these circles represent the abbreviation of each trait (see MATERIALS AND METHODS).

