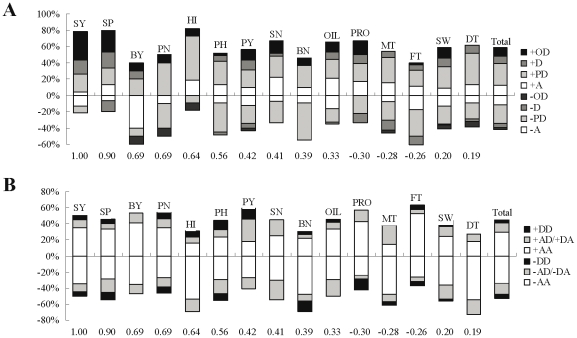
Figure 3. Distribution of qualitative mode-of-inheritance of QTL (A) and epistatic interactions (B) for 15 yield-correlated traits.
Each vertical bar represents the proportion of QTL and epistatic interactions for each trait, colored according to mode-of-inheritance categories: A, additive; PD, partial-dominant; D, dominant; OD, over-dominant; AA, additive × additive; AD/DA, additive × dominant/dominant × additive; DD, dominant × dominant. The bars above and under the abscissa are respectively for the QTL and epistatic interactions with positive (+) and negative (−) genetic effect. The correlation coefficients between each trait and seed yield were indicated at the bottom.

