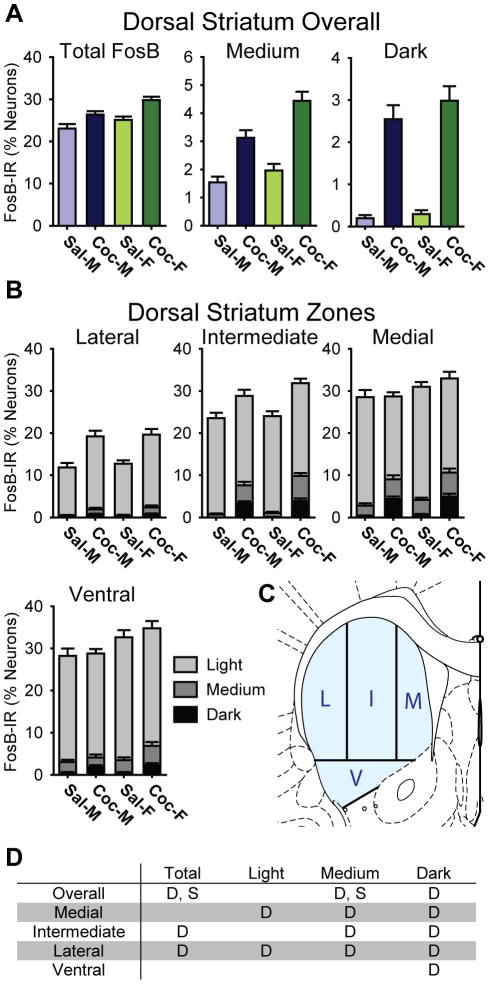
Figure 4. Cocaine induced regionally specific increases in FosB- IR in the dorsal striatum of male and female rats.
A) Bar graphs showing the percentage of all neurons in saline- (Sal) and cocaine- (Coc) treated male (M) and female (F) rats that were FosB-IR at any intensity level (Total FosB), and broken down into medium or darkly stained cells. B) Bar graphs showing the proportion of FosB-IR cells in each anatomical zone of the dorsal striatum. Each bar shows the percentage of all neurons in each treatment group that were light, medium, or darkly stained. Overall FosB-IR was higher in the Medial and Ventral, relative to the Lateral, zone, while cocaine-induced increases were most prominent in the Lateral zone. Additionally, females exhibited slightly higher FosB-IR than males. C) The partitioning scheme used to define Medial (M), Intermediate (I), Lateral (L), and Ventral (V) zones. D) A table summarizing the statistically significant differences (p<0.05) for dorsal striatum as a whole (Overall) and each of the zones. “D” indicates a significant drug effect, and “S” indicates a significant sex difference (See text).

