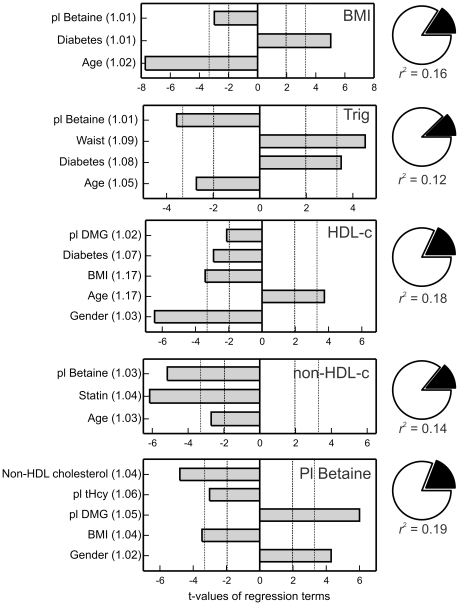
Figure 1. Regression variables affecting plasma betaine concentrations, plasma lipid fractions and body mass index (BMI).
Trig: plasma triglyceride concentration; HDL-c: HDL cholesterol; non-HDL-c: non-HDL cholesterol (total cholesterol - HDL cholesterol). The bars are the t-values of the significant variables, negative for variables with negative coefficients and positive for those with positive coefficients. Dashed vertical lines indicate p = 0.05; dotted vertical lines p = 0.001. Numbers in brackets after variable names are the variance inflation factors. Pie figures on the right show the portion of variance explained by regression (black). DMG: dimethylglycine.

