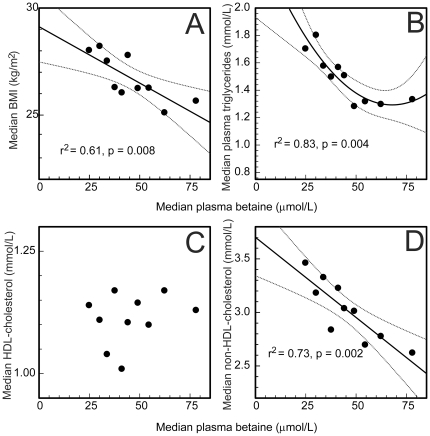
Figure 2. Plasma lipids and BMI as a function of plasma betaine concentrations.
Data grouped into deciles based on the plasma betaine concentrations, and median betaine concentrations of these plotted against A: median BMI, and the medians of the plasma lipid fractions (B: triglycerides, C: HDL cholesterol, D: non-HDL cholesterol). Regression lines (with 95% confidence intervals) shown when significant, straight lines (A&D) or curved (B) where the second order term is significant (p = 0.035).

