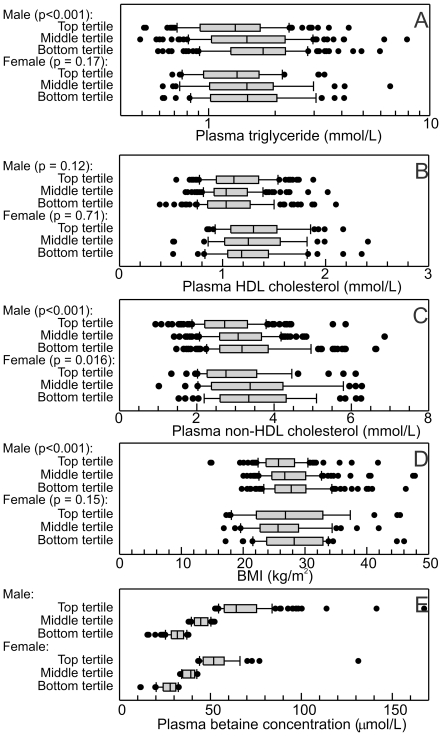
Figure 3. Plasma lipids and BMI in male (n = 382) and female (n = 150) patients with different tertiles of plasma betaine concentrations.
The solid boxes show the interquartile ranges, with the medians indicated, and the cap the 90%-ile, of the (A–C) plasma lipid concentrations in the subject groups, D the BMIs of the subjects, and E. for comparison, the plasma betaine concentrations in the tertiles. The significance (left) indicates whether there was a difference between the tertiles (ANOVA on ranks).

