
Figure 6. Smed-msh2 depletion enhances survival of mitotically active neoblasts in MNNG treated planarians.
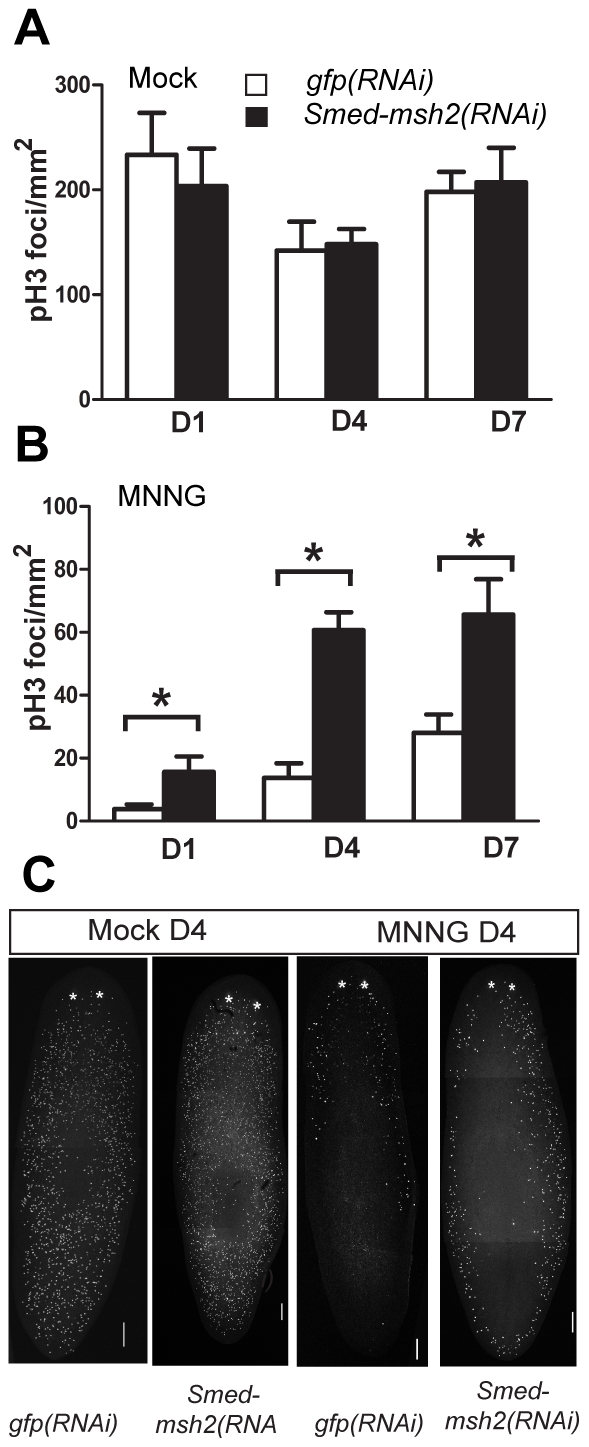
The number of H3ser10 p (pH 3) stained foci per mm2 as a marker of mitotically active neoblasts in mock (A) and MNNG (B) treated planarians. gfp(RNAi) and Smed-msh2(RNAi) animals were stained following exposure to 1.0 mg/g MNNG at days 1, 4, and 7-post injection. White bars: gfp(RNAi). Black bars: Smed-msh2(RNAi). Statistical differences measured by Student's t-test and error bars indicate SEM. (* indicates p<0.05) n = at least four animals per experiment with two experimental replicates. (C) Representative animals from day four time point. Dorsal view with anterior end at top. * indicates location of photoreceptors. Scale bars: 200 µm.