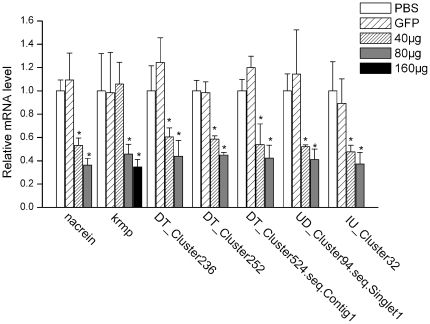
Figure 5. Expression levels of the selected genes knocked down by RNAi.
The expression levels of the selected genes were measured using real-time quantitative PCR. The expression levels were analyzed six days after dsRNA injection and five individuals were tested in each group. For the control, the expression levels of the PBS injected group were measured to a relative value of 1.0. The asterisk represents a significant (p<0.005) difference compared with the PBS-injected groups. A 160 µg dosage was only used in the krmp-injected group, because the expression did not decrease significantly in the 40 µg dosage-injected group.

